
Scritto da Ivana Basaric
Asset management is one of the main worries for those working in the field of Information Technology in an increasingly liquid and hybrid world. In 2020, with COVID-19, we have faced even more the challenge of how to effectively manage our devices when they are located outside our buildings, a challenge that will unquestionably continue in the future as well. Being aware of what you have in your company and, above all, being sure that the information you have is correct and updated means having processes allowing you to keep your data updated to reality. That is why at Elmec we have developed a CMDB called Atlantis, which you can find on our MyElmec Integrated Portal constituting, nowadays, the basis with which we deliver our services, and much more, to our clients.
Why do we mention Asset Management and CMDB when speaking about atlantis?
When we refer to CMDBs, one of the most common mistakes is to think of them just as discovery tools only detecting technical information without giving any of the information about our business, which is what CMDBs actually do. That is why, in this case, we are referring to a real asset management. As a matter of fact Atlantis, from the first overview dashboard, gives you an amount of information that transcends merely technical information on the items on the dashboard.
The first summary dashboard gives you information on the total number of items divided into groups: Infrastructure, Network, Workplace and Mobile. This Elmec-developed CMDB allows you to make changes manually, as well as giving you the option to add any items that are not included in Elmec service perimeter. As a matter of fact, Atlantis allows you to integrate CMDB writing and reading with other tools and software by API.
AlREADY HAVE MYELMEC? FIND OUT THE NEW DASHBOARD
NOT YET REGISTERED ON MYELMEC? FILL IN THE FORM AND START YOUR TRIAL
Operational Status
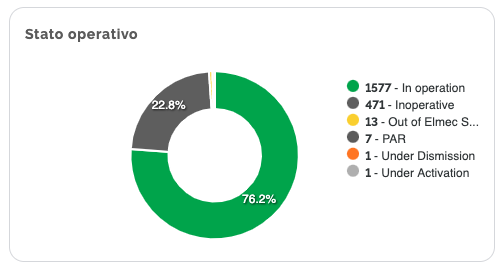
This chart is present in all of the four item groups and indicates, in case of “In Operating” status, that the machine is delivering service or, in PCs’ and mobile devices’ case, that these devices are on. “Inoperative” status means that the machine is deactivated or, for PCs and mobile devices, that they are off. For this specific status you can decide whether or not you wish to view these items, by clicking on “Preferences” and choosing “Show Inoperative Items” option. Another possible status is “Under Activation”, which means that the machine has been prepared and will soon be In Operation, whereas “Under Deactivation” means that the machine will soon change its status from In Operation to Inoperative. Finally, Out of Elmec Services status refers to those machines that are not under our services, giving you the chance to have all this information in one place, setting aside cumbersome Excel files.
Service Level
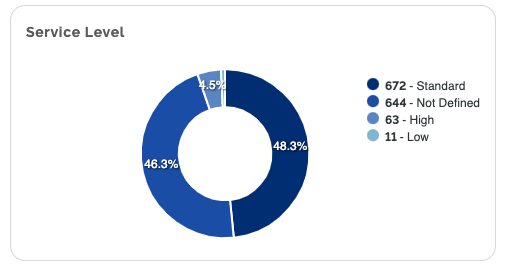
You can find this chart in the Infrastructure and Network group. It indicates the service level you have agreed to with us. For example, if a machine is particularly critical for your business, our service level that you requested will most likely be higher and may require a 24/7 monitoring. By contrast, there may be lower service levels if machines require monitoring only during business days. All this information depends on the terms you have agreed to with us.
Criticality
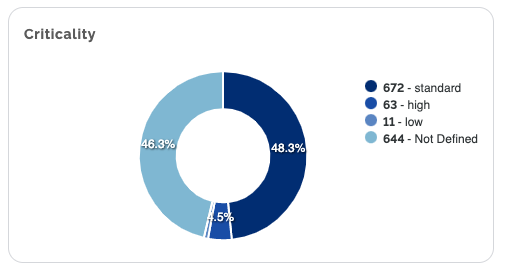
You can also find this chart in the Infrastructure and Network group. It indicates machine criticality based on their importance in your business. Therefore, a machine can be highly critical depending on the importance of the information on that machine. For example, if a server is hosting an application that is particularly relevant for your business, so that if it stops working your users become inoperative, it implies that that machine is highly critical nd, consequently, we have to focus special attention on it while delivering our service. Obviously machine criticality level, which can be high, medium or low, is determined by you as a client when our service is activated.
Environment
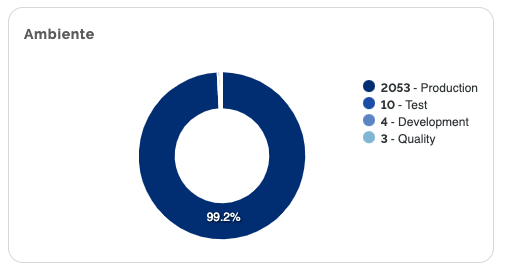
This information is available in the Infrastructure and Network group. It indicates the environment in which a particular item is used: production, testing, development and quality.
Items per Location, Item per country
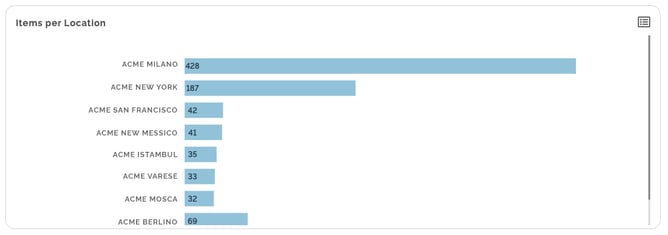
You can find these charts in the Infrastructure and Network group as well. They indicate where items are located in your business and the countries in which they are located.
Items per OS
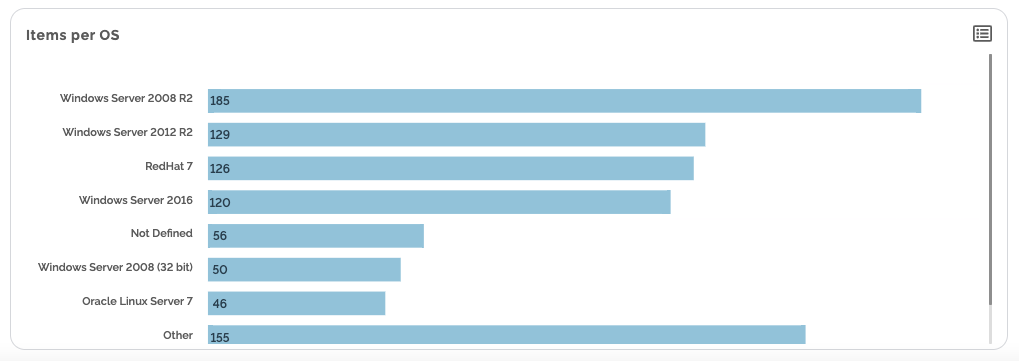
You can also find this chart in the Network and Infrastructure group. It indicates the items filtered by installed Operating Systems.
Items per Manufacturer
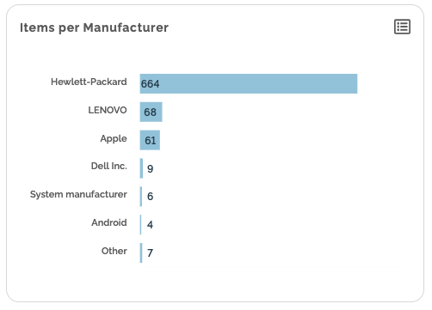
You can find this chart in the Workplace group. It indicates the number of items filtered by the device manufacturer.
Apple devices
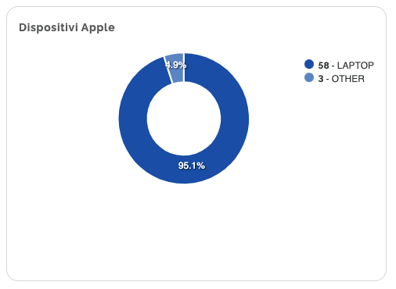
You can also find this chart in the Workplace group. It indicates Apple devices filtered by type: laptops, all in one models, etc…
Items by model
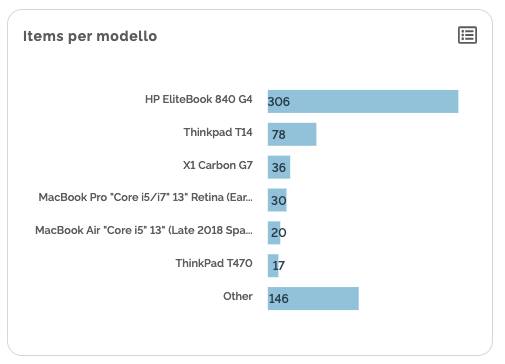
You can also find this chart in the Workplace and Mobile group. It allows you to view the number of devices filtered by PC or phone model.
Items by Business Area
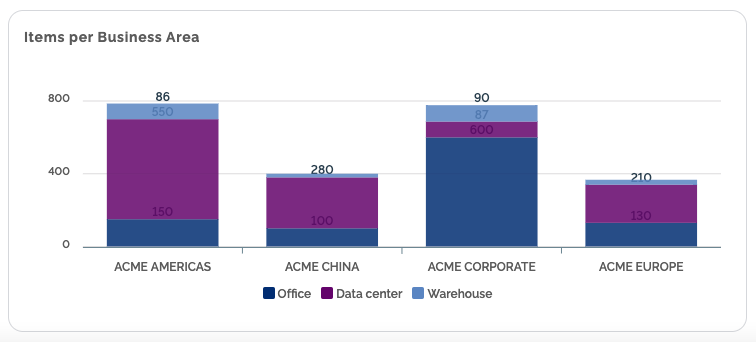
This chart, which you can find in the Workplace and Mobile group, indicates the Business Areas in which devices are located, filtered even further locations. If you have different locations in Asia, for example, you can create a South Asian Business Area and see in which locations most of your devices are located. You may find this information useful especially if you need to check any costs for the different areas.
Operating systems
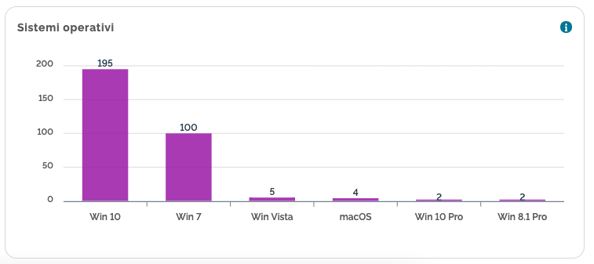
This chart, which you can find in the Workplace and Mobile group, indicates the items filtered by operating systems installed on the various devices.
Item list
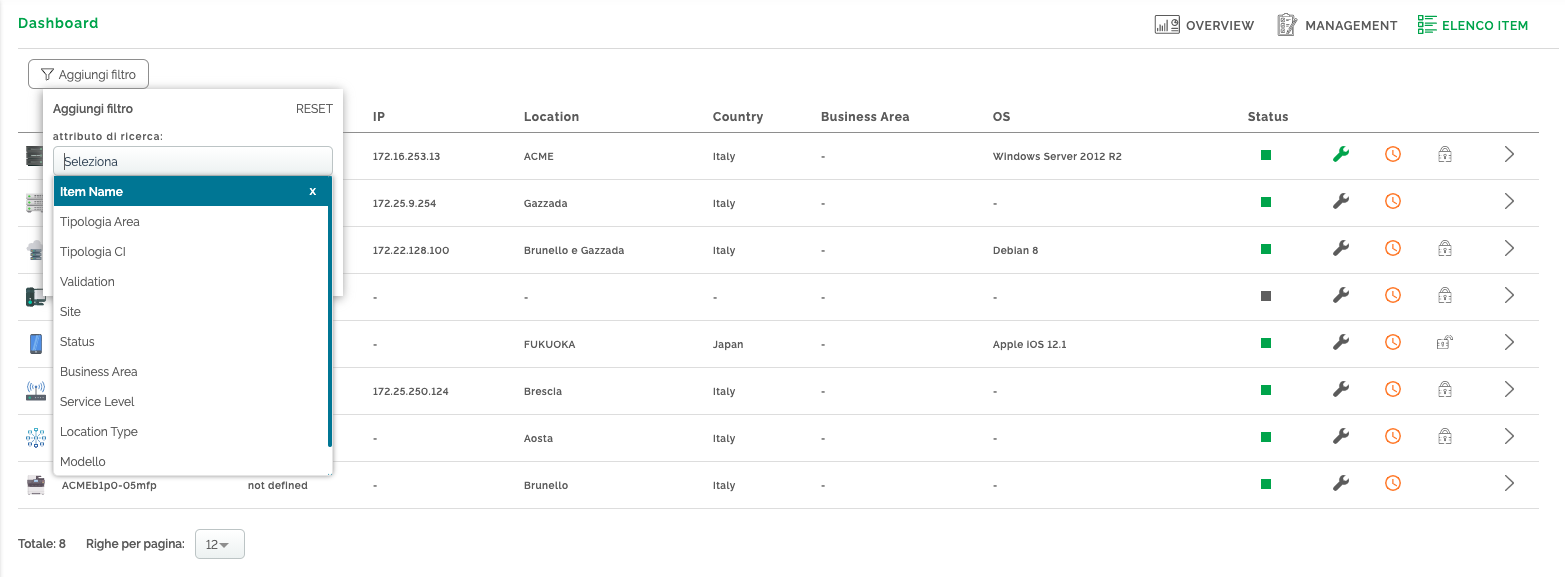
In this section you can view all the items without being filtered by groups, with the option for you to apply the numerous filters available.
Item group
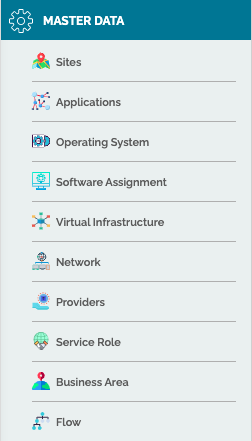
On the left-hand menu you can view the items filtered by groups which are, in turn, filtered by type. From here you can go to Infrastructure group details and view all its CIs: servers, storage, virtual hosting, etc. In the Workplace group, instead, you can find everything related to a workplace: printers, PCs, mobile devices and users, because users too have to be managed to know what kind of devices they have.
In the Other section you can find Appliances and clusters, whereas in Master Data you can find all those items, like applications, associated with any other CIs in the CMDB.
Details of each CI
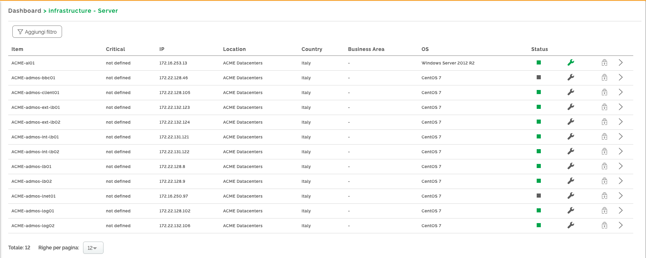
If you click on the server details you will find a CI list on which you will always be able to apply any filters for a quicker search.
In this list you will find the information you already see in the Overview, but you will be able to see more details. In particular, you can see when and if any Windows maintenance sessions are scheduled (spanner symbol) or whether the machine can be modified (lock symbol).
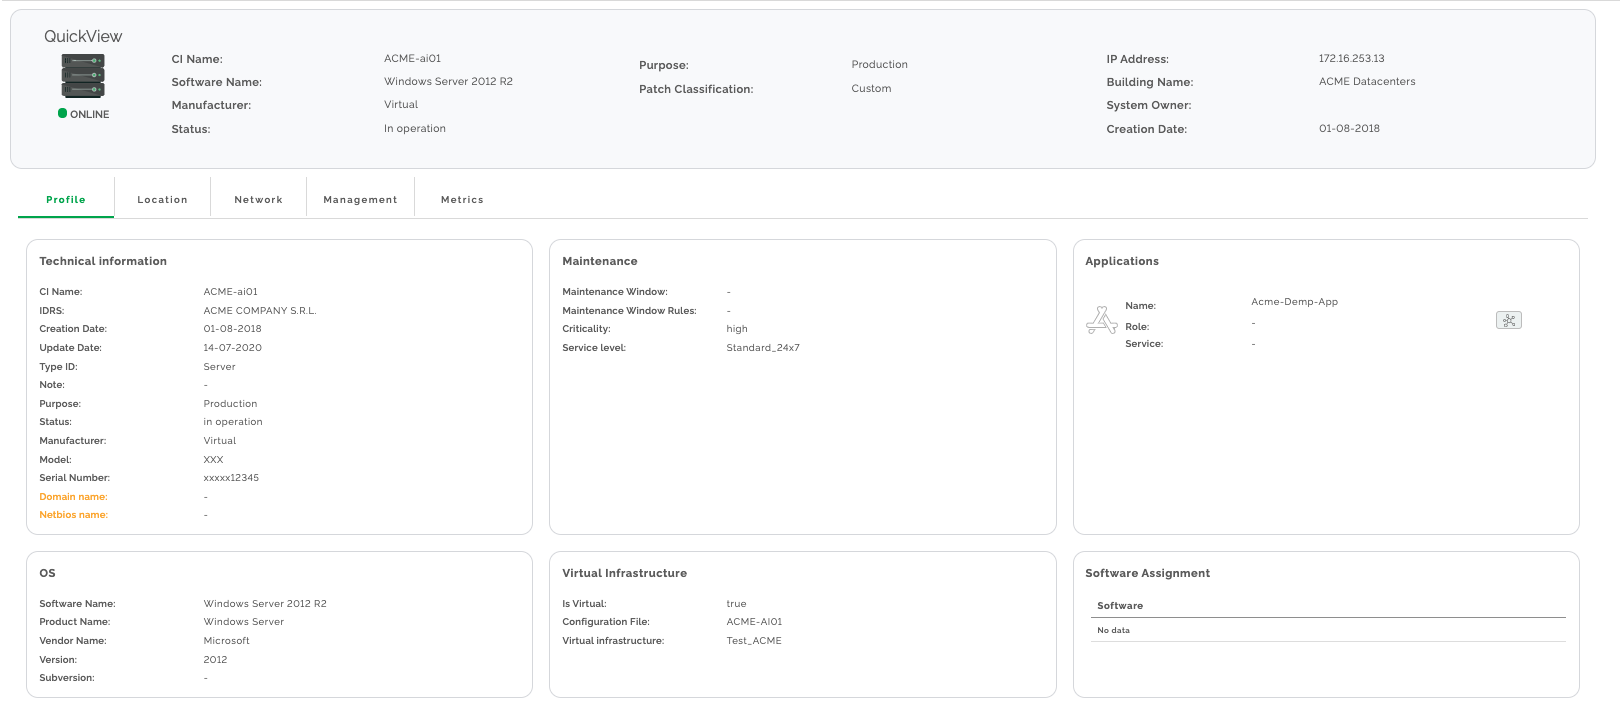
To understand the information available for each item, we will use servers as an example, but the same logic applies to the CIs of the other groups as well. First, you can know if your machine is online, that is, if the monitoring tool checking whether the host can be reached is working.
You can know all the machine’s technical information, its location, its network(s), and any information about Management, particularly that related to Lifecycle, Ownership and patch activity planning, to which we have dedicated an ad-hoc dashboard..
Application Maps
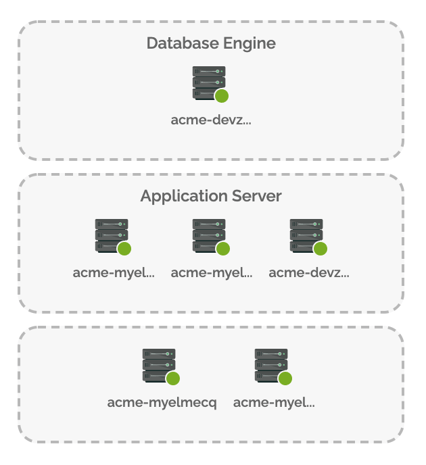
In servers’ case, you can view any application(s) on that machine and connect to application maps directly from the CMDB. These maps will show you an Infrastructure Map of all the items involved in application delivery, their role in such delivery (DB, application server, web, etc…) and any possible malfunction.
Metrics
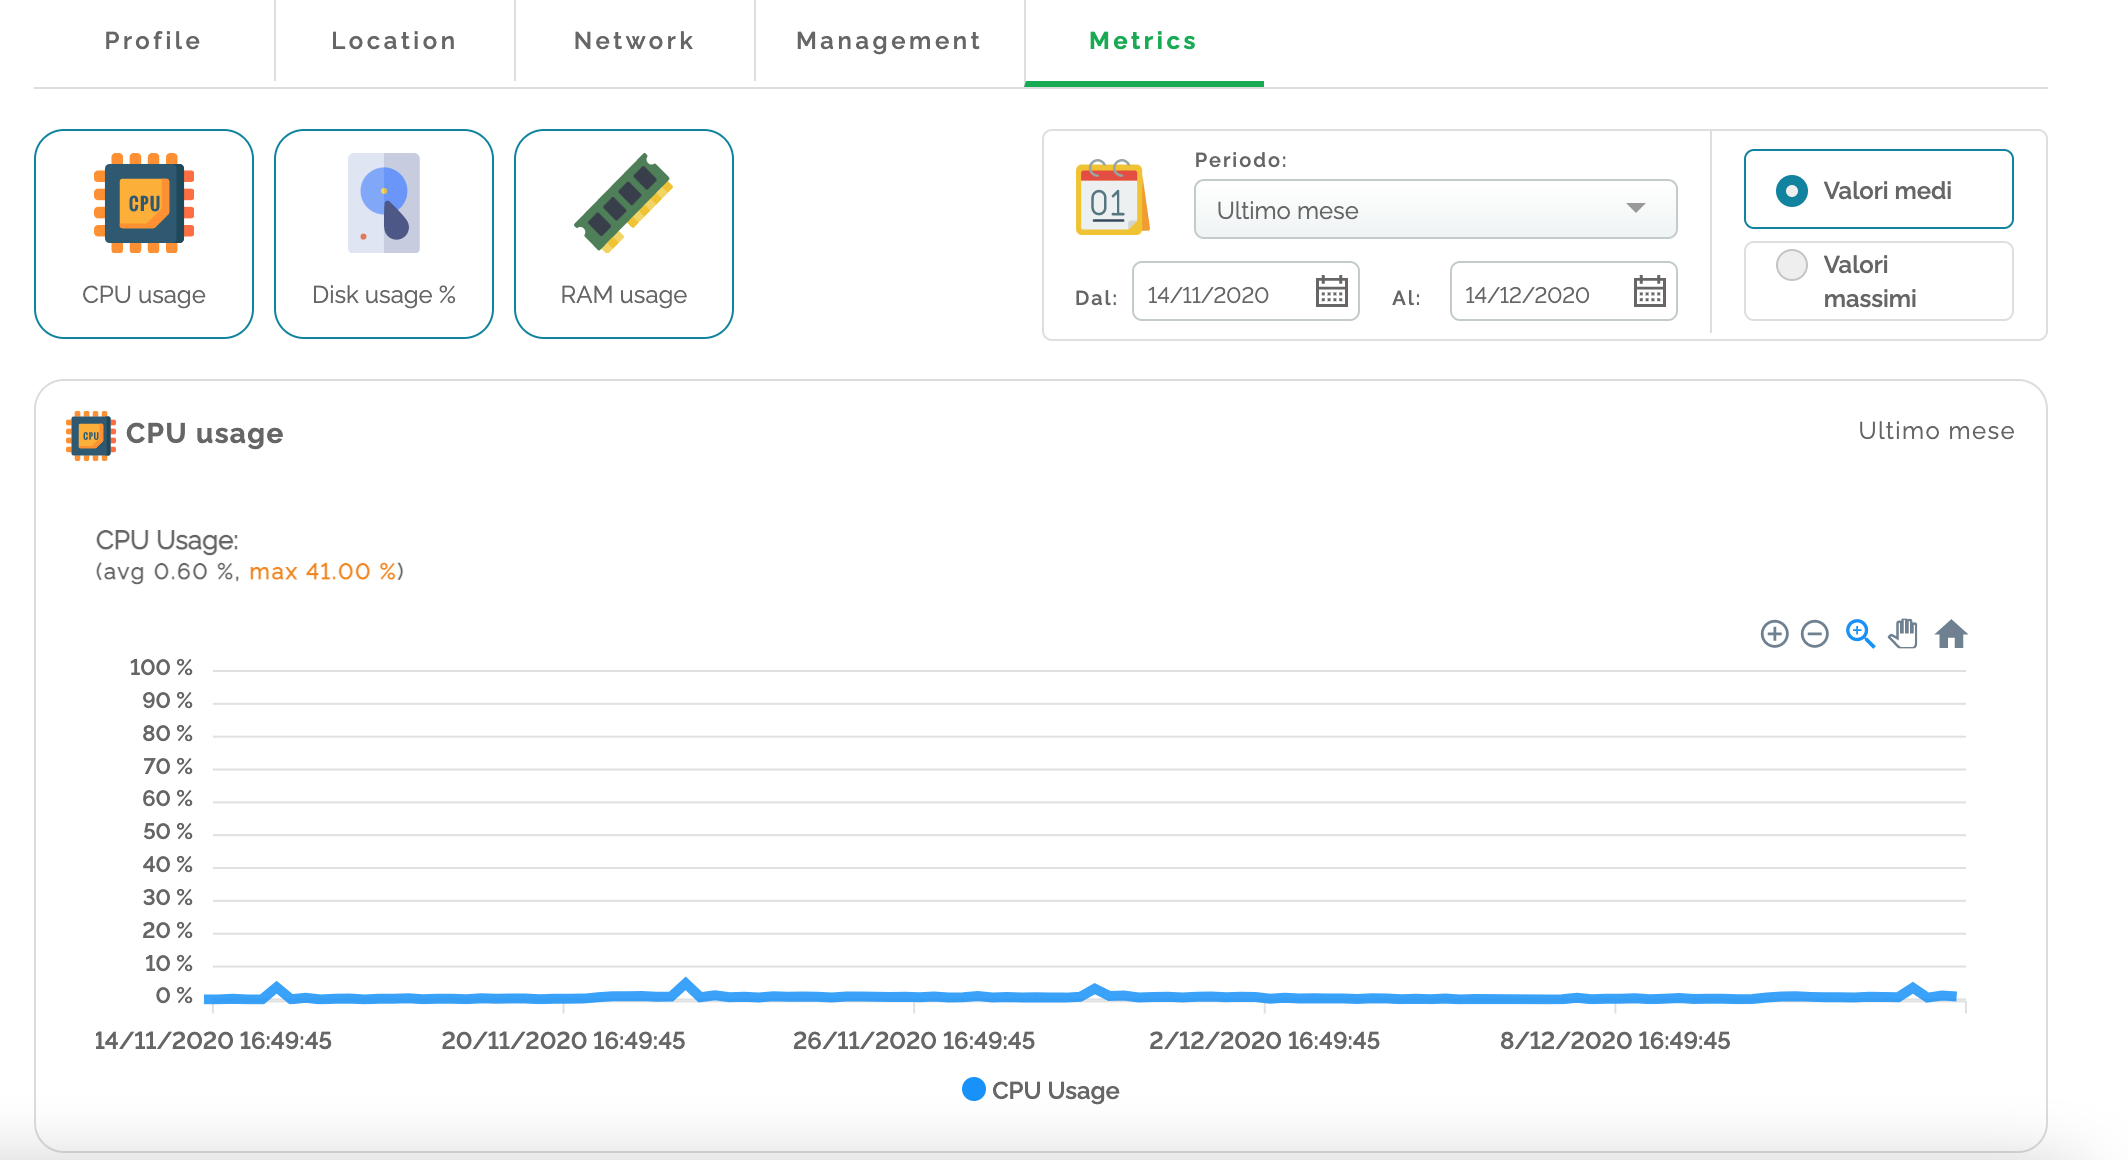
In servers’ case, the metrics section is accessible to allow you to see the resources the VM triptych is made up of and, therefore, analyse and check whether the machine has been correctly set up. You can decide, either for UPS, RAM or a disk, whether to view any average or maximum values, or to filter any results by a defined time period or a time range.
CMDB as a basis for all services
If there are any Elmec-managed services, to build all the other dashboards making MyElmc portal, CMDB Atlantis plays a fundamental and essential role. The basis for Elmec service, just as the portal’s correct performance, depend on how correct the information contained in the CMDB Atlantis is.
Are you curious and want to explore Atlantis world?
LOGIN TO MYELMEC
NOT IN MY ELMEC?
Fill in the form below and start your MyElmec 1-month demo!